How to Read TikTok Ads Analytics and Identify Winning Campaigns
A dashboard full of green numbers doesn't mean a campaign is profitable. Here is how to read TikTok ads analytics the way an experienced media buyer does.

TikTok Ads Manager surfaces dozens of metrics on a single results screen, and it is entirely possible to look at a campaign, see several numbers trending in a favorable direction, and still be losing money. Impressions can climb, CTR can look healthy, and CPC can be low, while the campaign as a whole remains unprofitable. This happens because most people read metrics one at a time instead of reading them against each other, and because platform-reported numbers rarely mean exactly what they appear to mean at first glance.
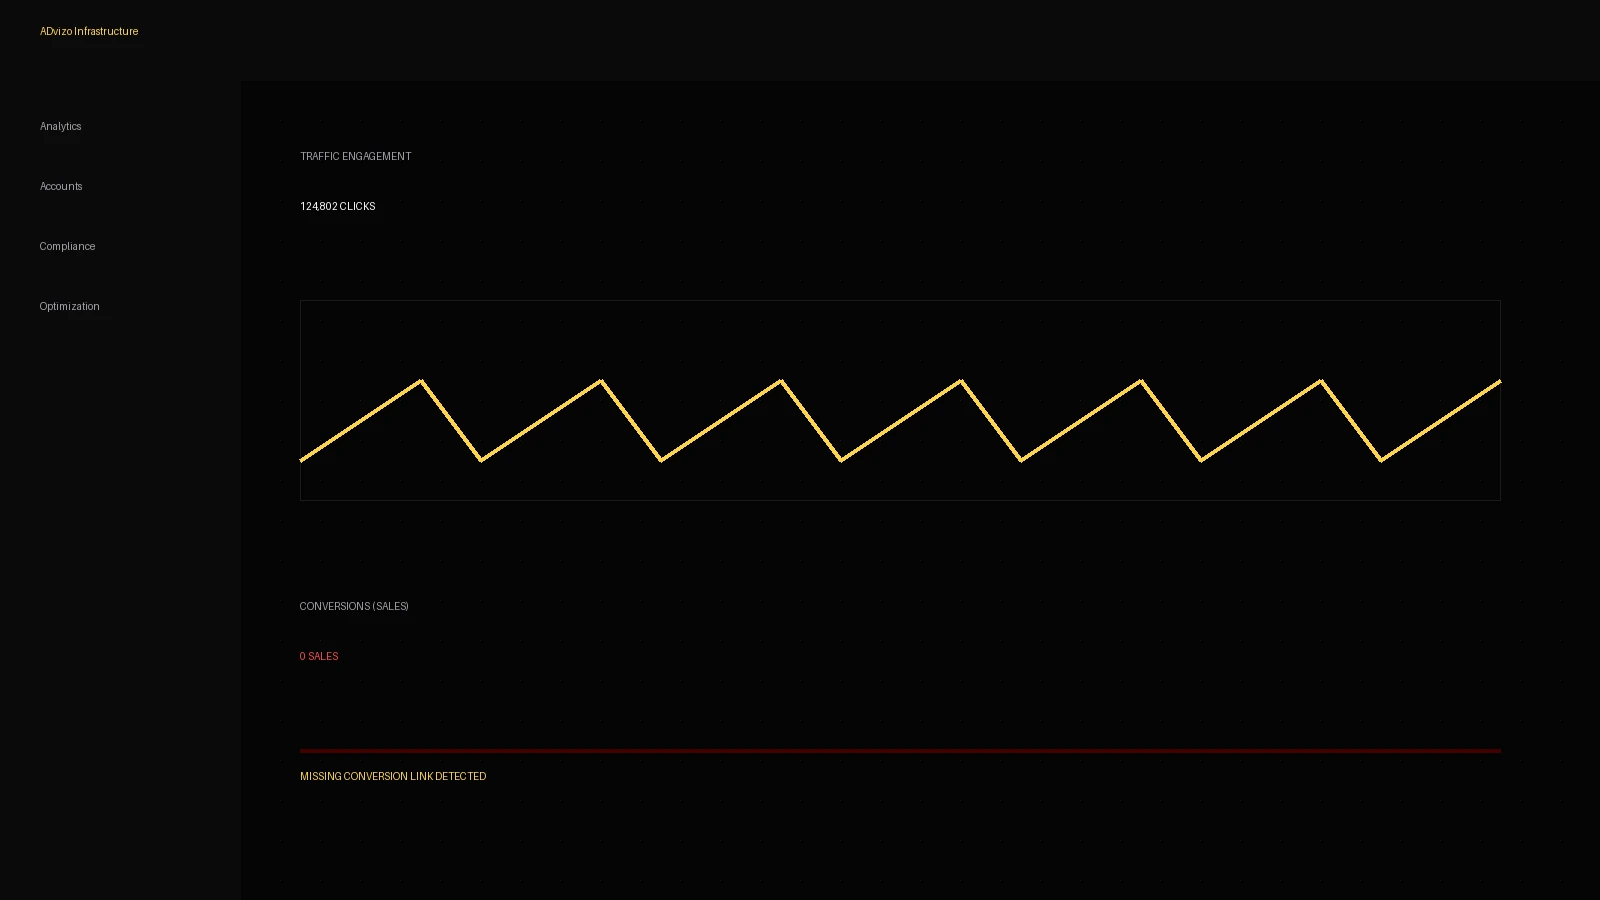
This guide walks through the core TikTok ads metrics in the order they should be read — from awareness through conversion — explains what each one is actually measuring, and shows how to combine them to identify a genuinely winning campaign rather than one that merely looks good on a single line item. It also covers the most common misreadings: a low CPC that hides a bad audience, a high ROAS built on tiny spend that will not survive scaling, and the structural gap between what the ad platform reports as a conversion and what your own backend or attribution tool records.
Two things are worth stating up front. First, exact metric names, available breakdowns, and attribution window options in TikTok Ads Manager vary by account type, market, and eligibility, and the interface changes over time — this guide focuses on the underlying concepts, which remain stable even as labels change. Second, no single metric tells the full story on its own. Reading TikTok ads analytics well is a skill of triangulation: cross-referencing volume, cost, quality, and revenue signals until they agree, and treating any signal that disagrees with the others as a flag to investigate rather than ignore.
Why Metrics Must Be Read Together, Not Alone
Every metric in TikTok Ads Manager measures one narrow slice of user behavior. Impressions measure how often your ad was shown. CTR measures how often a shown ad was clicked. CPA measures how much you paid per conversion the platform recorded. None of these, alone, tells you whether the business made money. A campaign can have an excellent CTR and a poor CPA if the audience clicks readily but rarely completes the target action. A campaign can have a good CPA and still be unprofitable if the average order value is too low to cover that acquisition cost plus product cost. Reading analytics correctly means moving through the funnel in order and checking that each stage's numbers are consistent with the stage before and after it.
Core Delivery Metrics: Impressions, Reach, and Frequency
Impressions count every time your ad was shown, including repeat views to the same person. Reach counts the number of unique users who saw it at least once. Frequency is impressions divided by reach — the average number of times each unique user saw your ad within the reporting window. These three numbers together tell you how your budget was distributed across an audience, and they are the first thing to check before looking at any cost or performance number, because delivery patterns explain a lot of what happens downstream.
Rising frequency against a flat or shrinking reach, while overall performance metrics start to soften, is one of the most reliable early signals of audience fatigue: you are increasingly re-showing the same ad to the same people rather than reaching new ones, and diminishing returns typically follow. Checking frequency alongside CTR is more informative than checking either alone — a falling CTR with stable frequency points to creative fatigue or a saturating audience, while a falling CTR with rising frequency points more specifically toward the same users seeing the ad too often.
Cost Metrics: CPM and CPC
CPM (cost per thousand impressions) reflects how competitive the auction is for your targeted audience at that moment — it moves with competition, seasonality, audience size, and your own bid or cost settings. CPC (cost per click) combines CPM with CTR: a lower CPC can come from a genuinely lower auction cost, or simply from a higher CTR pulling more clicks out of the same impressions. Neither number on its own indicates efficiency toward your actual business goal; they indicate cost of attention and cost of interest, respectively.
This is precisely why a low CPC is one of the most commonly misread metrics in TikTok advertising. A low CPC tells you that clicks were cheap. It says nothing about whether those clicks converted, what they converted into, or whether the resulting revenue covered the cost of acquiring them. Campaigns optimized toward a click-based goal will often show an excellent CPC while producing a poor CPA, because the delivery system is doing exactly what it was told: finding cheap clicks, not profitable customers. Treat CPC as a diagnostic of auction and creative appeal, never as a proxy for profitability.
Engagement Quality: CTR, Hook Rate, and Hold Rate
CTR (click-through rate) measures the share of impressions that resulted in a click. It is a useful early signal of whether your creative and offer are resonating with the audience being served, but it should always be read alongside video engagement metrics rather than in isolation, because a click-optimized ad can produce a high CTR from viewers who were never genuinely interested in the product.
Hook rate — typically the share of viewers who watch past the first few seconds — tells you whether your opening frame or opening line is stopping the scroll. Hold rate — typically the share of viewers who watch through a meaningful portion or the full length of the video — tells you whether the substance of the ad, once someone stops scrolling, is compelling enough to keep their attention. A creative with a strong hook rate but a weak hold rate is grabbing attention with an opening hook that the rest of the video fails to deliver on; a creative with a weak hook rate never gets the chance to prove whether the rest of it works. Reading these two numbers together, rather than a single blended 'video view rate,' usually points precisely to which part of the creative needs to be rebuilt.
Conversion Metrics: Conversion Rate, CPA, and Engagement-to-Purchase
Conversion rate measures the share of clicks (or landing page visits) that complete your target action. It is the metric most sensitive to factors outside the ad itself — landing page speed, offer clarity, checkout friction, price positioning — which is why a sudden conversion rate drop with stable upstream metrics (CTR, CPC) often points to something broken on the website or app, not the ad or the targeting.
CPA (cost per acquisition) is the aggregated cost of everything upstream: impressions, clicks, and conversion rate all compound into this single number. It is genuinely useful, but only when read against your actual breakeven cost — a number that lives outside the ads platform entirely, in your margin structure. TikTok Ads Manager has no knowledge of your product cost, shipping cost, refund rate, or customer lifetime value, so it cannot tell you whether a given CPA is good; only your own business math can.
Revenue Metrics: ROAS, Revenue, and Spend
ROAS (return on ad spend) is revenue attributed to the campaign divided by spend. It is the metric most often misread, for two structural reasons. First, ROAS ignores margin: a 4x ROAS on a product with thin margins can be less profitable than a 2x ROAS on a high-margin product. Second, and more importantly for reading daily reports, ROAS calculated on a very small spend base is statistically unstable and can swing wildly on the strength of one or two large orders that happened to land in the reporting window.
This is the second major misleading pattern worth calling out explicitly: a headline ROAS of, say, several multiples on a spend base of a small number of dollars is not evidence of a scalable, winning campaign. It is a sample size of a handful of purchases. The same audience and creative, given ten times the budget, will regress toward a more representative — usually lower — ROAS as the delivery system reaches beyond the small pocket of highest-intent users it found first. Never scale budget aggressively off an early ROAS spike without checking the underlying order count first.
Attribution Windows and Why Numbers Rarely Match Exactly
An attribution window is the period of time after an ad interaction during which a resulting conversion is credited to that ad. TikTok Ads Manager, your website analytics tool, and your backend order system frequently use different attribution logic, different windows, and sometimes fundamentally different crediting models (platform-reported click-and-view attribution versus a strict last-click or first-touch model elsewhere). This is why the number of conversions shown in Ads Manager will almost never match exactly with the orders recorded in your store or CRM for the same period, and why that mismatch is normal, not necessarily an error.
The direction of the mismatch is informative even when the exact size of it is not perfectly reconcilable. If the ad platform consistently reports more conversions than your backend, part of the gap is likely attribution model differences (e.g., view-through credit) rather than fraud or a tracking failure, though it is still worth verifying deduplication and event setup. If your backend consistently shows more orders than any single ad platform reports, other channels or organic traffic are contributing to conversions the ad platform never gets to claim credit for, which is normal in a multi-channel funnel. For deeper coverage of tracking setup itself, see how to track TikTok ads conversions.
Funnel-Stage Metric Map
It helps to organize the same metrics above by funnel stage, so you know which numbers to prioritize depending on what a given campaign is actually trying to achieve.
| Funnel Stage | Primary Metrics to Watch | What They Tell You |
|---|---|---|
| Awareness | Impressions, Reach, Frequency, CPM | How far and how efficiently your budget is spreading across a new or broad audience, and whether repeat exposure is becoming excessive. |
| Consideration | CTR, Hook Rate, Hold Rate, CPC | Whether the creative is stopping the scroll, holding attention, and generating cheap enough interest to justify moving users further down funnel. |
| Conversion | Conversion Rate, CPA, ROAS, Revenue | Whether interested traffic is actually completing the target action at a cost the business can sustain, and whether resulting revenue clears your margin threshold. |
| Scaling | CPA/ROAS stability across rising spend, Frequency, Order count | Whether performance holds as budget increases and the audience widens, or whether early results were a small, unrepresentative sample. |
A Second View: Metric Ownership by Team Role
| Metric | Primarily Reflects | Who Should Act On It First |
|---|---|---|
| CPM | Auction competitiveness and audience size | Media buyer adjusting targeting or budget pacing |
| CTR / Hook / Hold Rate | Creative and hook strength | Creative team iterating on scripts and opening frames |
| Conversion Rate | Landing page, offer, and checkout friction | Web/product team, not the media buyer alone |
| CPA | Combined efficiency of ad, landing page, and offer | Media buyer and marketing lead jointly |
| ROAS | Revenue efficiency relative to spend, filtered through margin | Finance-aware marketing lead, using true margin data |
Misleading Interpretations to Watch For
A low CPC does not mean profitable traffic
As covered above, CPC measures cost of interest, not cost of a customer. A campaign optimized for clicks can produce an excellent CPC while attracting users who rarely convert, because the delivery system was never asked to evaluate purchase likelihood — only click likelihood.
A high ROAS on tiny spend is not evidence of scalability
A handful of early conversions can produce a striking ROAS purely by chance of small-sample variance. Before treating an early ROAS number as a signal to scale aggressively, check the underlying order count; a ROAS built on fewer than a handful of orders is a data point, not yet a trend.
Platform-reported conversions and last-click backend conversions are not the same measurement
Ads Manager may include view-through or broader-window credit that a strict last-click backend system does not, and vice versa a backend system credits organic and other-channel assisted conversions that the ad platform never sees. Comparing the two numbers as if they should match exactly leads to false conclusions about tracking being 'broken' when the real cause is simply different attribution logic.
A stable average can hide an unstable distribution
An average CPA within target can still be masking two very different groups of conversions underneath — some very cheap and low-quality, some appropriately priced and high-quality. Whenever possible, look at conversion quality (refund rate, repeat purchase, lead qualification) alongside the average cost metric, not instead of it.
Improving engagement metrics do not guarantee improving revenue
It is possible for hook rate, hold rate, and CTR to all improve after a creative refresh while conversion rate and CPA get worse, if the more engaging creative attracted a broader but lower-intent audience. Always confirm an engagement improvement carries through to the conversion stage before declaring a creative change a win.
Why Numbers Do Not Reconcile: A Troubleshooting Path
When the conversions or revenue shown in TikTok Ads Manager clearly disagree with your backend numbers by more than attribution-window differences can reasonably explain, work through the discrepancy in a fixed order rather than guessing.
- 1Confirm the reporting date ranges and time zones actually match between the ad platform and your backend system; a one-day offset alone can create an apparent discrepancy that is not real.
- 2Check which attribution window and attribution model each system is using, and whether the ad platform's window is wider or narrower than your backend's crediting logic.
- 3Verify the conversion event itself is firing correctly and only once per genuine conversion; duplicate firing (e.g., a purchase event triggering on a page refresh) inflates the platform-reported number independent of attribution differences.
- 4Check for deduplication issues between web and app events, or between pixel-based and server-side (API) event sources, which can double-count the same conversion.
- 5Segment by device and browser; tracking loss from privacy settings or in-app browser restrictions affects some traffic sources more than others and can explain a persistent, directional gap.
- 6If the gap is new rather than persistent, check whether a recent website, checkout, or tracking implementation change coincides with when the discrepancy started.
- 7If everything above checks out and a modest gap remains, accept that some level of discrepancy between platform-reported and backend numbers is structurally normal, and use platform data for optimization decisions while using backend data as the source of truth for financial reporting.
Common Mistakes When Reading TikTok Ads Analytics
- Judging a campaign on a single metric (usually CPC or CTR) without checking whether it agrees with downstream CPA and ROAS.
- Scaling budget aggressively based on an early ROAS spike built on very few orders.
- Treating a mismatch between platform-reported and backend conversions as a tracking failure without first checking attribution windows and models.
- Comparing CPA or ROAS across campaigns using different optimization events or bidding approaches as if the numbers are directly comparable.
- Reacting to daily fluctuations instead of evaluating performance over a stable reporting window long enough to smooth out normal variance.
- Ignoring frequency and reach while only watching cost metrics, missing early signs of audience fatigue.
- Using platform ROAS as the sole profitability metric without factoring in product margin, shipping cost, and return rate.
- Blaming the ad account for a conversion rate drop that was actually caused by a landing page or checkout issue.
Expert Tips
Build a simple weekly summary that places CPM, CTR, hook/hold rate, conversion rate, CPA, and ROAS side by side for each active campaign, rather than reviewing each metric in a separate tab. Reading them in one row makes it far easier to spot where the funnel is actually breaking down.
Keep a running note of your true breakeven CPA and target ROAS, calculated from your own margin structure, next to your reporting dashboard. Platform data has no concept of profitability; you have to bring that number yourself and check every report against it.
When comparing campaigns or creative variants, hold spend level and reporting window roughly constant across the comparison. Comparing a campaign with a week of data against one with a single day of data will produce misleading conclusions regardless of which metric you're looking at.
Reporting Checklist
- Have I checked delivery metrics (impressions, reach, frequency) before jumping to cost or conversion metrics?
- Does my CTR and hook/hold rate story match my conversion rate story, or are they pulling in opposite directions?
- Have I calculated CPA and ROAS against my actual margin-based breakeven, not just against a general benchmark?
- Is the ROAS or CPA I'm evaluating based on enough orders/conversions to be statistically meaningful, or is it a small-sample spike?
- Have I reconciled platform-reported conversions against backend orders and accounted for attribution window differences?
- Have I ruled out landing page, checkout, or tracking issues before attributing a performance drop to the ad or audience?
- Am I comparing this reporting period against a comparably sized and comparably timed prior period?
Conclusion
Reading TikTok ads analytics well is less about knowing what each metric is called and more about knowing how they relate to each other and where each one can mislead you in isolation. Delivery metrics tell you how your budget spread; cost metrics tell you how competitive the auction was; engagement metrics tell you whether your creative earned attention; conversion and revenue metrics tell you whether that attention turned into business results worth the spend. A winning campaign is one where all of these layers agree, cross-checked against your own margin math and reconciled — even if imperfectly — against your backend numbers. Treat any single green metric with healthy skepticism until the rest of the funnel confirms it.
For further reading, explore the official documentation: TikTok Pixel Setup, Events API Documentation, Measurement Solutions.
Frequently asked questions
Which TikTok ads metric matters most?
No single metric matters most on its own. The metric that matters is whichever one corresponds to your actual business goal (CPA for lead volume, ROAS for revenue efficiency), read alongside the upstream metrics that explain why it looks the way it does.
Why doesn't my TikTok Ads Manager conversion count match my store's order count?
The two systems typically use different attribution windows and crediting logic. Ads Manager may include broader attribution models such as view-through credit, while a backend system often credits only last-click or first-touch orders, so a gap in either direction is usually normal rather than a tracking failure.
Is a high ROAS always a sign of a winning campaign?
Not by itself. A high ROAS calculated on a very small number of orders is statistically unstable and often regresses once budget and audience size increase. Always check the underlying order count before treating an early ROAS number as proof of a scalable campaign.
Why is my CTR high but my sales are low?
A high CTR shows people are clicking, not that they are buying. If the campaign is optimized for clicks or the audience or landing page doesn't match buyer intent, you can generate cheap, plentiful clicks that rarely convert. Check conversion rate and CPA before judging the campaign on CTR alone.
What is the difference between hook rate and hold rate?
Hook rate typically reflects how many viewers keep watching past the first few seconds, indicating whether the opening grabs attention. Hold rate reflects how many viewers watch through a meaningful portion or the whole video, indicating whether the content itself sustains interest once it has been earned.
How much conversion data do I need before trusting a CPA or ROAS number?
There's no fixed universal threshold, but as a general principle, the fewer conversions a number is based on, the more it can swing from a single order or lead. Treat early numbers as directional and wait for a larger, more stable sample before making major budget decisions.
My numbers used to reconcile with my backend and now they don't — what changed?
Start by checking for a recent change to your website, checkout flow, or tracking implementation, since a newly introduced discrepancy is usually tied to a specific technical change rather than a sudden shift in platform behavior. Compare reporting windows and event firing before assuming the platform itself is at fault.
Keywords covered in this article
The topics and search terms this guide addresses.
Primary keyword
how to analyze tiktok ads
Related keywords
- tiktok ads analytics
- tiktok ads reporting
- tiktok ads metrics explained
- tiktok ctr and cpc
- tiktok hook rate hold rate
- tiktok roas vs cpa
- tiktok attribution window
- tiktok ads dashboard metrics
- tiktok conversion tracking discrepancy
- tiktok ads funnel metrics
- tiktok video view metrics
- tiktok campaign performance analysis
Topics
- analytics-tracking
- media-buying
- optimization
- tutorials